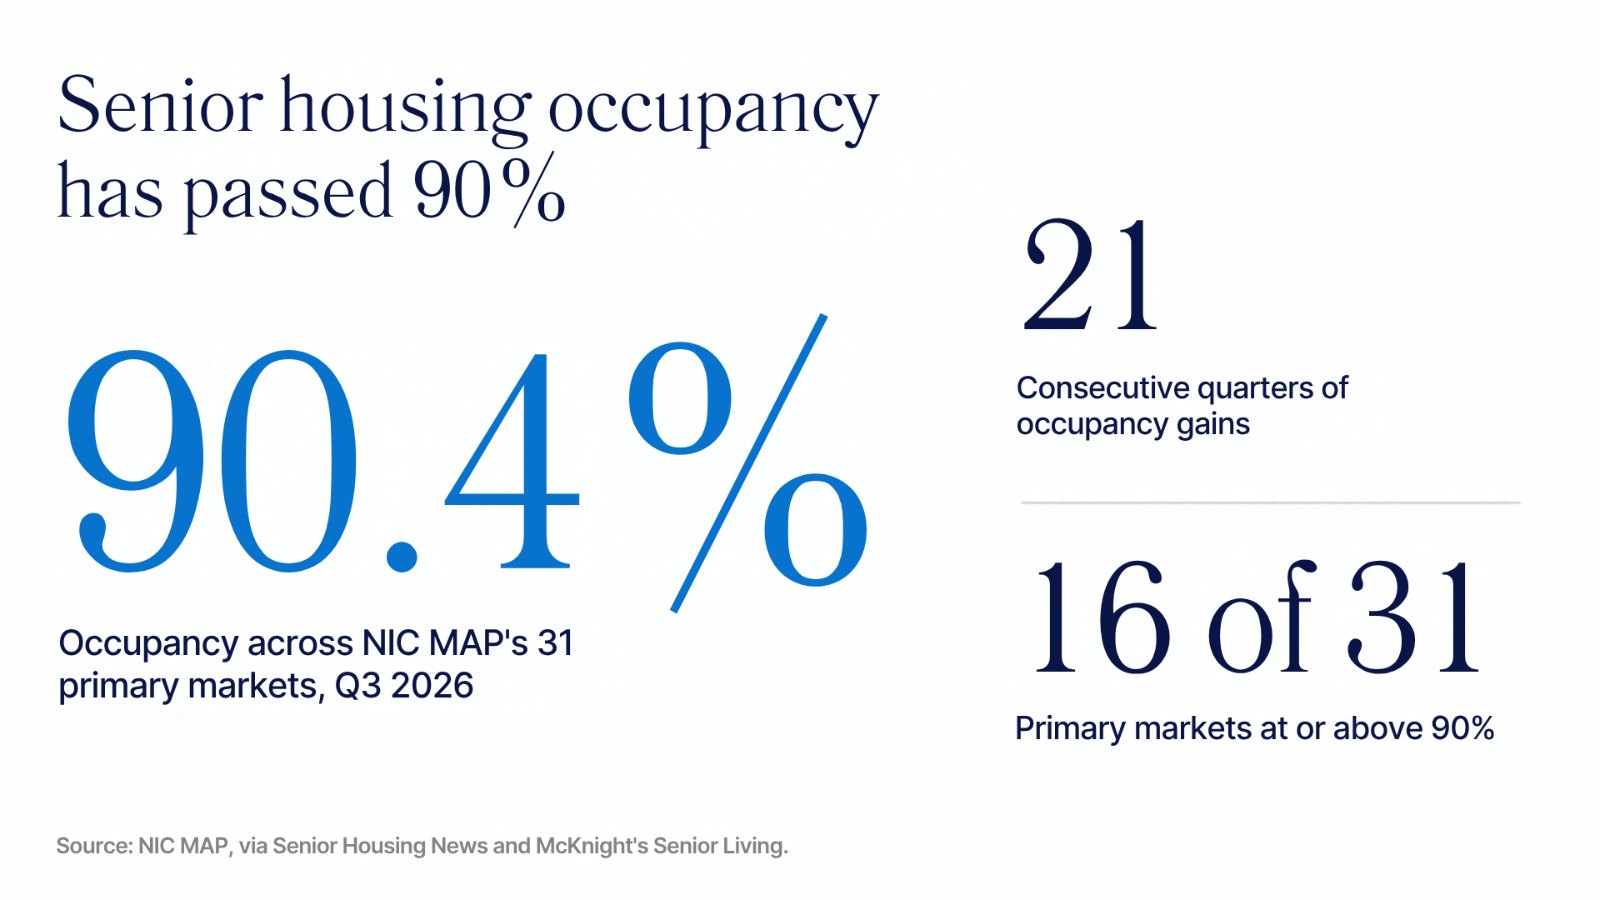
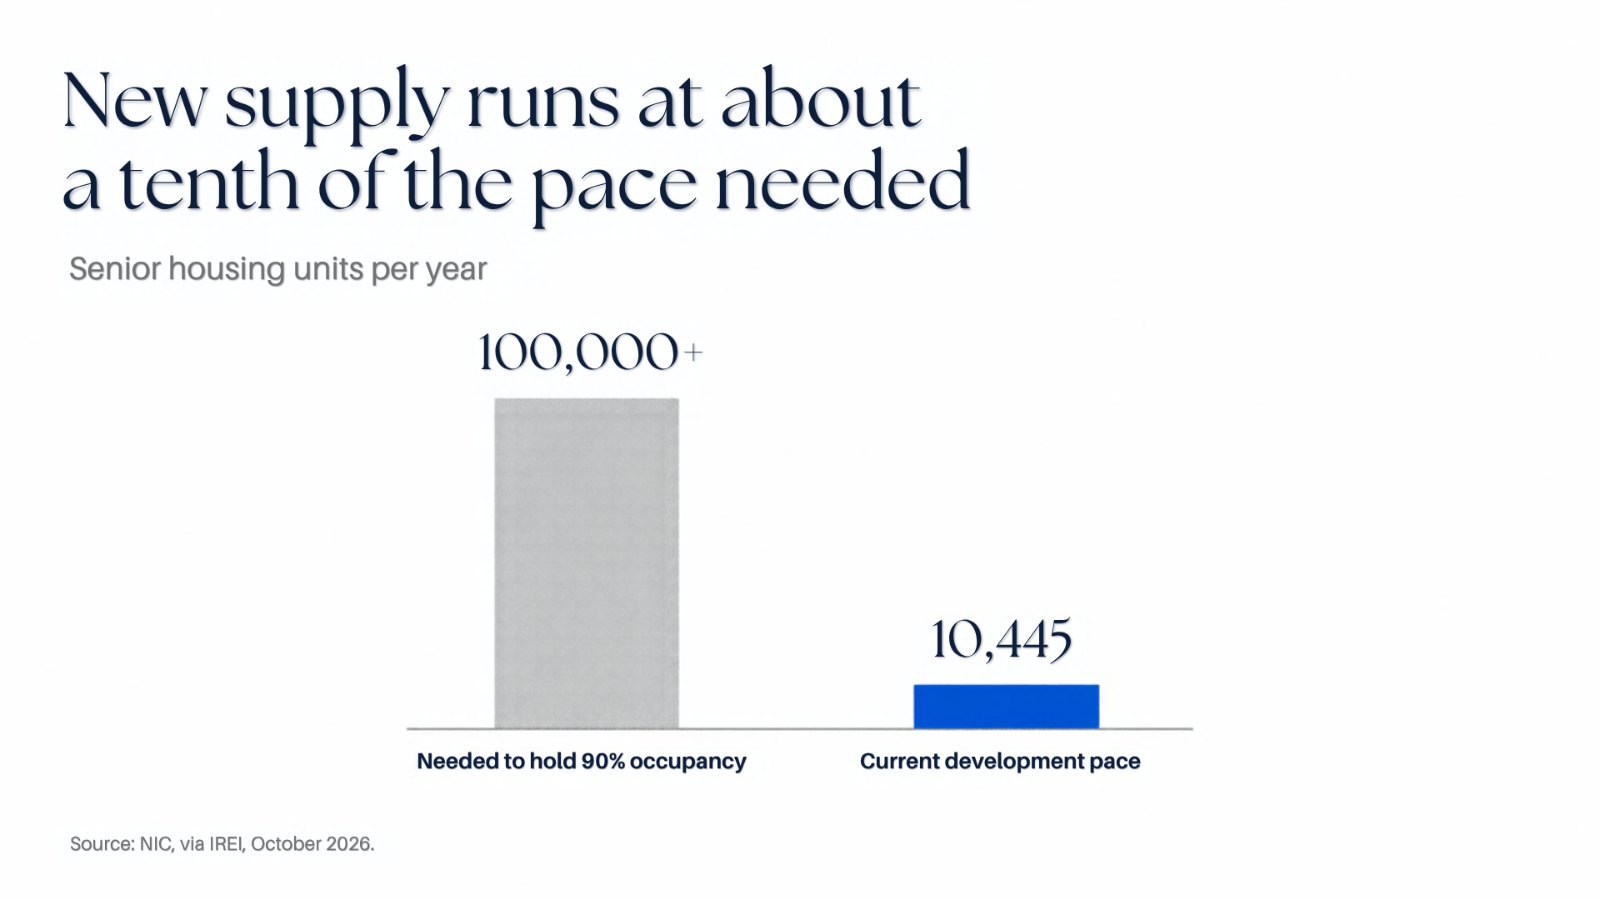
Senior housing occupancy across the 31 primary markets tracked by NIC MAP reached 90.4% in the third quarter, according to data the National Investment Center for Seniors Housing & Care released on October 1. It was the 21st consecutive quarterly gain. Occupied units rose to 644,428, and 16 of the 31 markets now sit at or above 90%. Inventory grew just 0.4% over the year, and NIC estimates that holding occupancy at 90% as the population ages would require more than 100,000 new units in most years through the late 2030s. The industry is currently delivering 10,445 units a year, roughly a tenth of that figure.
Most of the coverage has treated the 90% mark as the moment development restarts. We read the signal differently. At 90%, senior housing has moved from a recovery in demand into a shortage of supply, and the cost of new construction is high enough that supply cannot close the gap in this cycle. Occupancy will level off, and the adjustment will run through rents. That puts resident affordability, more than occupancy, at the center of the sector’s next phase.
High occupancy is expected to pull new supply back in
The common reading follows the logic of any property market. When occupancy rises above 90% and rents keep growing, developers return, new communities open, and occupancy settles back toward a balanced level. NIC’s Lisa McCracken said the organization is hearing anecdotally that planning for new development is picking up. Capital has also returned to the sector: NIC MAP recorded $21.8 billion of closed senior housing transactions over the four quarters to the third quarter of 2025, more than 40% above the prior year.
On that view, today’s tight market is the top of a normal cycle, and investors should expect supply to catch up within a few years.
The arithmetic of new supply does not close
The scale of the gap makes that outcome unlikely. Development would need to run at about ten times its current pace just to keep occupancy at 90%, and NIC has said the industry would need to build at nearly twice its maximum historical rate every year for two decades to do so. Only 16,159 units were in development in the third quarter.
“Development would need to run at about ten times its current pace just to keep occupancy at 90%.”
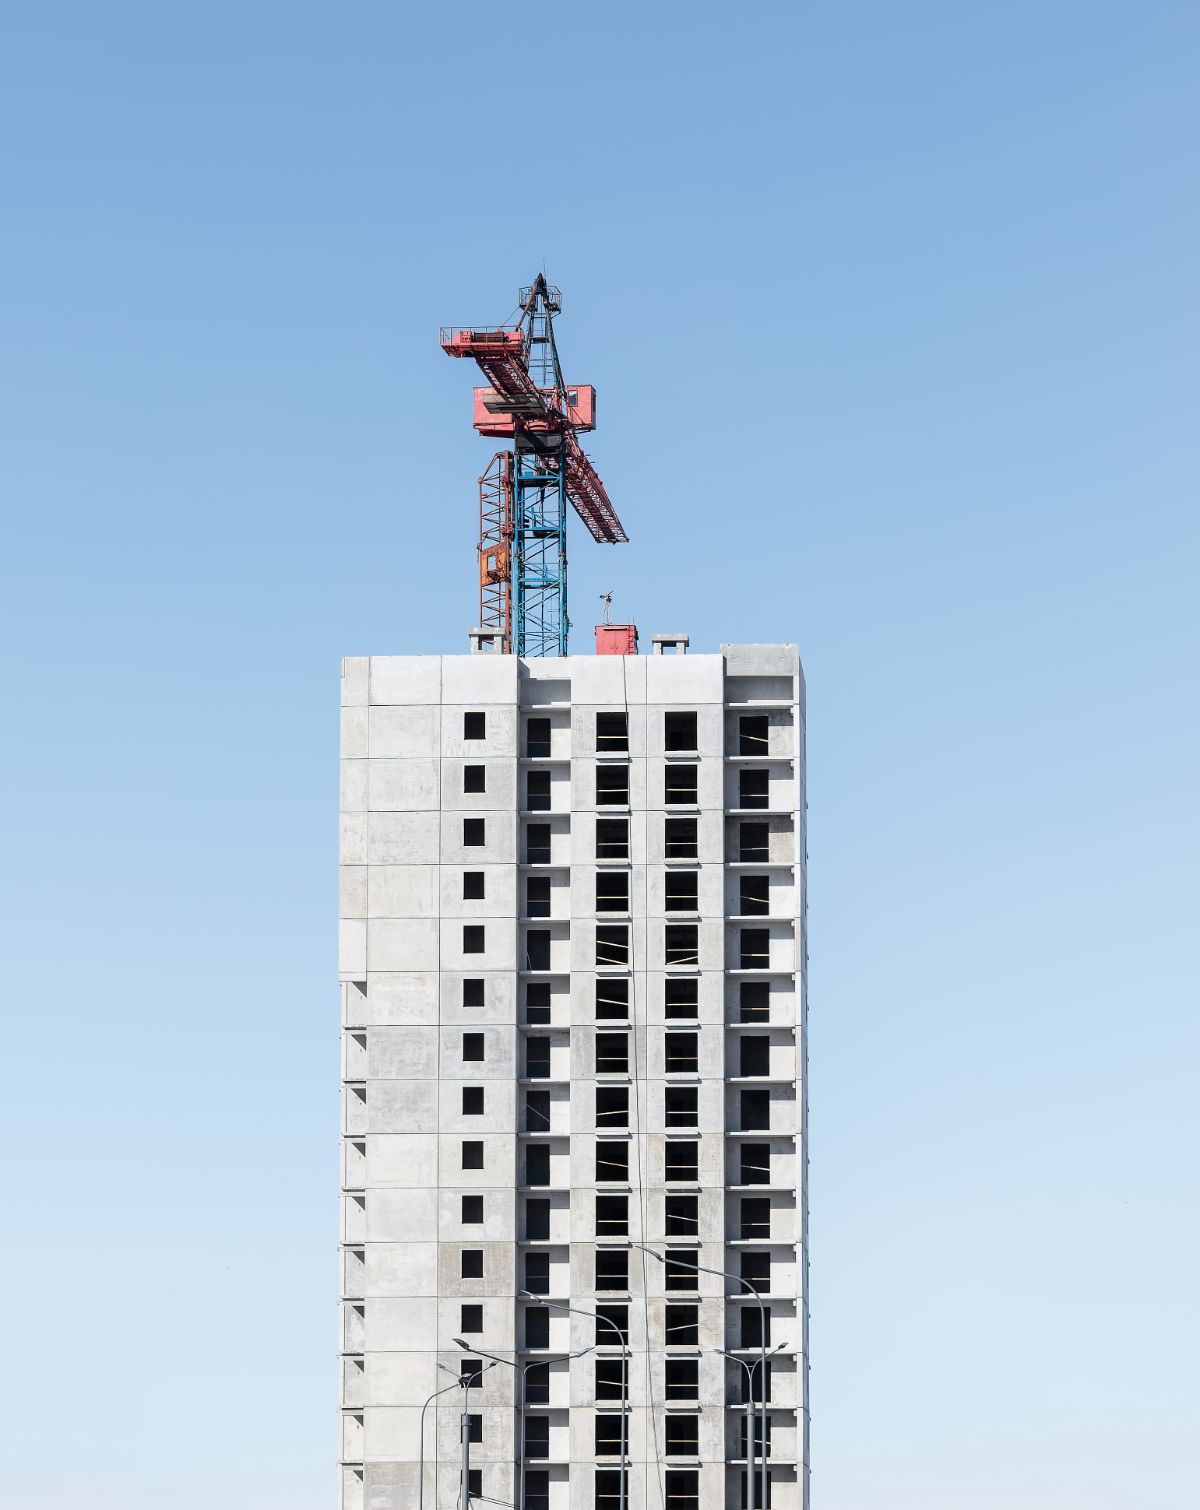
The cost of building has also risen. Nonresidential construction input prices were 8.9% higher in August than a year earlier, according to data reported by CRE Daily, and the 10-year Treasury yield reached 5.3% on October 1, its highest level since 2002. Senior housing development carries the cost of a residential building together with the cost of the services and common space that come with it. At current construction costs and rates, new communities need rents well above what much of today’s demand can pay, which limits how many projects can be financed even as occupancy rises.
The last time starts fell below openings was 2009
The current supply pattern has few precedents. The ULI and PwC Emerging Trends report noted that new units breaking ground fell below new units opening in 2021, and before that in 2009, during the global financial crisis. Year-over-year inventory growth in 2025 was the lowest since NIC began tracking the series in 2006.
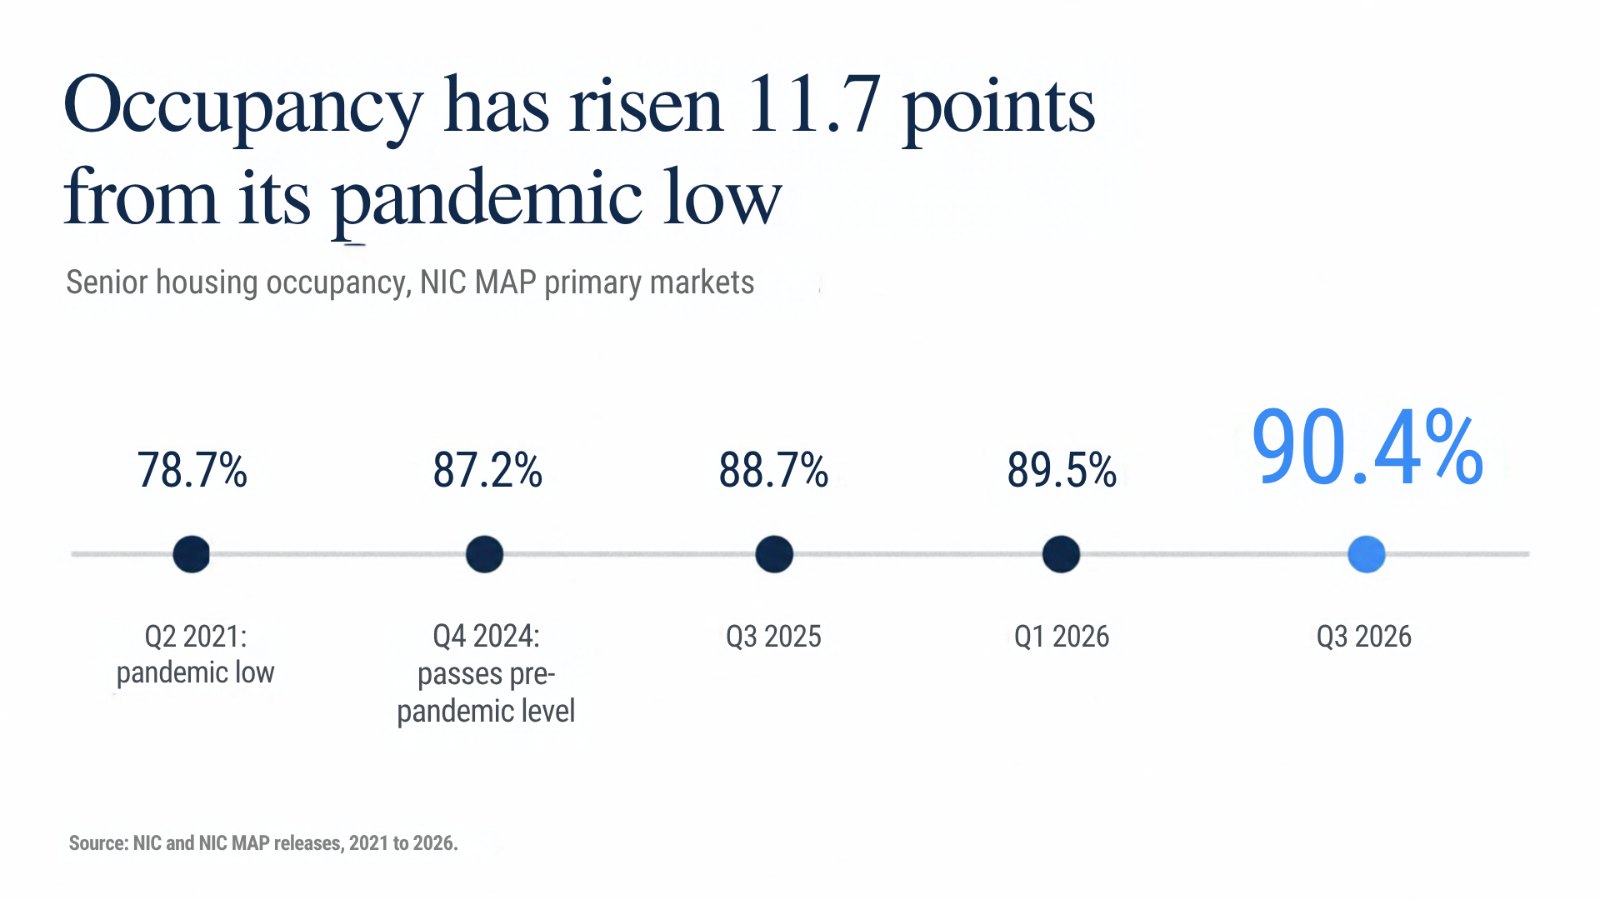
The recovery in occupancy has been steep. NIC reported a pandemic low of 78.7% in the second quarter of 2021. The sector passed its pre-pandemic level in the fourth quarter of 2024 at 87.2% and has added roughly half a point a quarter since. NIC’s analysts expect occupancy to approach 93% by 2028, which would be the highest level recorded in the 20 years NIC MAP has published the data.
Occupancy will level off, and rents will carry the adjustment
Occupancy cannot rise indefinitely. Most operators need some vacancy for unit turnover, and the highest occupancy NIC has recorded in any single market is 95.6%. As more markets approach that ceiling, the price of a unit becomes the variable that balances demand and supply. NIC MAP reported annual rent growth of 4.3% in the third quarter of 2025, and we expect growth at or above that pace in the tightest markets through 2027.
The pressure will fall unevenly across residents. NIC has said that middle-income older adults, who do not qualify for subsidized housing but cannot easily afford private-pay senior living, are the group most affected by the current balance of supply and demand. As rents rise faster than incomes, more of the demand in each market will come from higher-income households, and the sector’s growth will depend on how much of that demand each market contains.
Markets are splitting by the depth of local demand
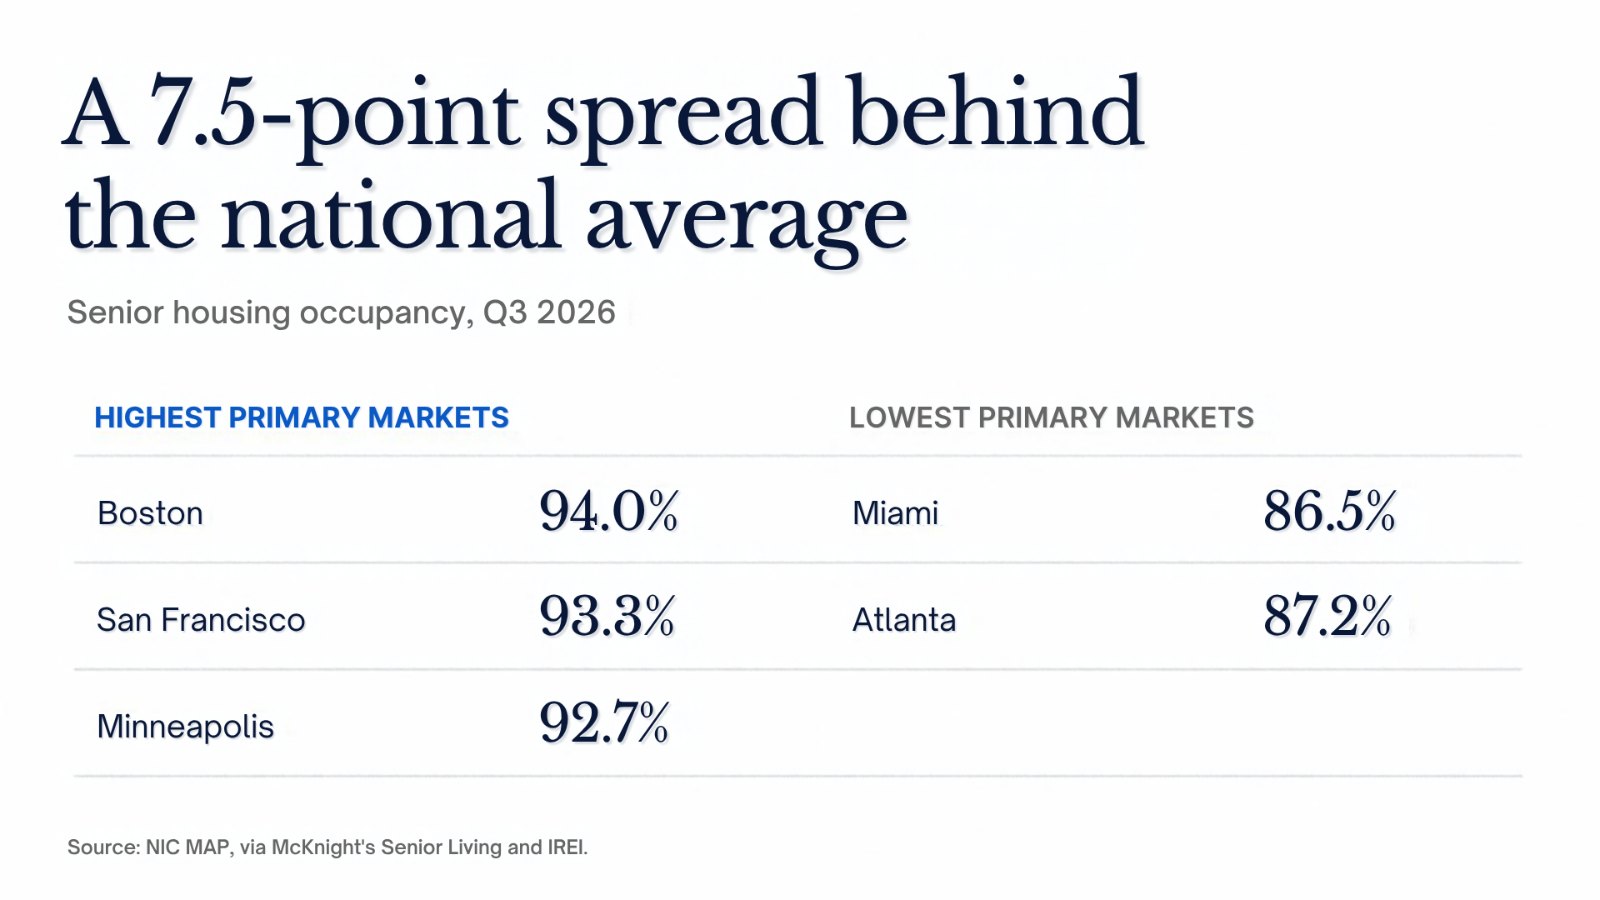
The spread across primary markets is already wide. Boston stood at 94.0% in the third quarter, San Francisco at 93.3% and Minneapolis at 92.7%, while Atlanta was at 87.2% and Miami at 86.5%. A national occupancy figure of 90.4% conceals a gap of 7.5 percentage points between the strongest and weakest primary markets. Markets with deep pools of affluent older households and little new supply will see the fastest rent growth. Markets that still carry recent deliveries will take longer to reach the point where pricing power shifts to operators.
Planning activity is the main risk to this view
The serious counterargument is that developers respond faster than published data shows. Planning activity appears in the data only once projects break ground, and McCracken’s comment suggests some of it is underway. Active adult communities, which require fewer services, can also be built at lower cost per unit, and occupancy there reached 93.2% in the third quarter.
We think new planning will matter in specific submarkets and will not change the national direction. Even a doubling of the current development pace would leave deliveries at about a fifth of the level NIC says is needed. Higher Treasury yields also make construction financing more expensive at exactly the moment developers would need it. Active adult product serves a younger and healthier resident and does little to relieve demand for assisted living, where occupancy rose fastest of any care type in the third quarter.
What the 90% signal points to
Over the next four to six quarters, we expect national occupancy to keep rising toward the low 90s, with rent growth replacing occupancy as the main driver of operating income in the strongest markets. For investors, the implication is that underwriting should give more weight to local income depth and rent capacity than to the national occupancy trend.
The 90% figure will be read as a milestone. For the sector, it marks the point where growth depends on the number of older adults who can pay for a unit, a number that rises more slowly than the number who need one.
Sources: National Investment Center for Seniors Housing & Care and NIC MAP (via Senior Housing News, McKnight’s Senior Living, IREI and Seniors Housing Business); PwC and ULI Emerging Trends in Real Estate; CRE Daily (construction inputs; 10-year Treasury, October 2026).