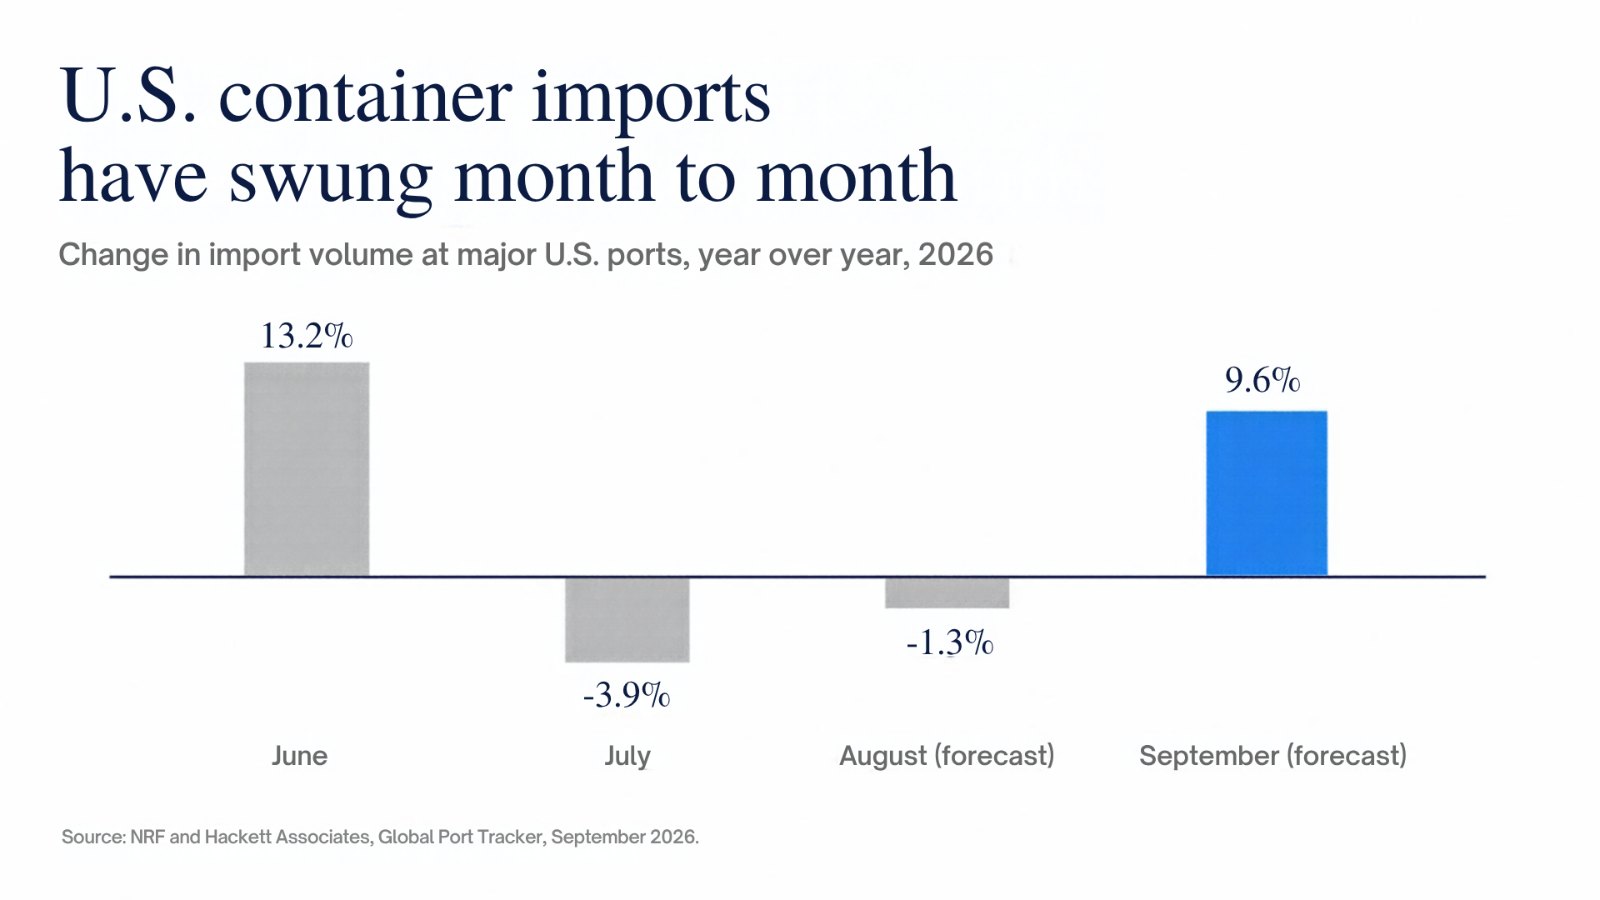
On September 9, the National Retail Federation and Hackett Associates raised their forecast for September container imports at major U.S. ports to 2.31 million TEU, up 9.6% from a year earlier. A month before, the same Global Port Tracker had forecast September at 2.16 million TEU, a rise of 2.8%, and had described the peak shipping season as winding down. The revised figure would make September the busiest import month of 2026. For the full year, the tracker still expects about 25.5 million TEU, almost unchanged from 2025.
The swing in a single month’s forecast has been read as another sign of tariff noise. We think it says something more lasting about warehouse demand. Imports for the year are flat, yet U.S. industrial absorption has been running well above its recent average. Occupiers are leasing space to manage uncertainty in the timing of their goods, more than to handle growth in their volume. That change favors modern, large-format logistics space and makes the national vacancy rate a weaker guide to where the industrial market is heading.
Volatile imports are usually read as a risk to warehouse demand
The common reading links warehouse demand directly to the flow of goods. When imports rise, retailers and logistics firms need more space; when imports stall, they release it. On that view, a year of flat import volume and shifting tariff rules should mean softer leasing. The tariff picture has been unsettled: temporary 10% global tariffs expired on July 23 and were replaced the next day by Section 301 tariffs of 10% to 12.5% on imports from 60 economies, which NRF said affect 99% of U.S. imports.
The import data itself has swung sharply. July volume of 2.3 million TEU was down 3.9% from a year earlier, while June had been up 13.2%. Retailers brought goods in early ahead of the July tariff change, then kept importing longer than forecasters expected.
Absorption has risen while import volume stayed flat
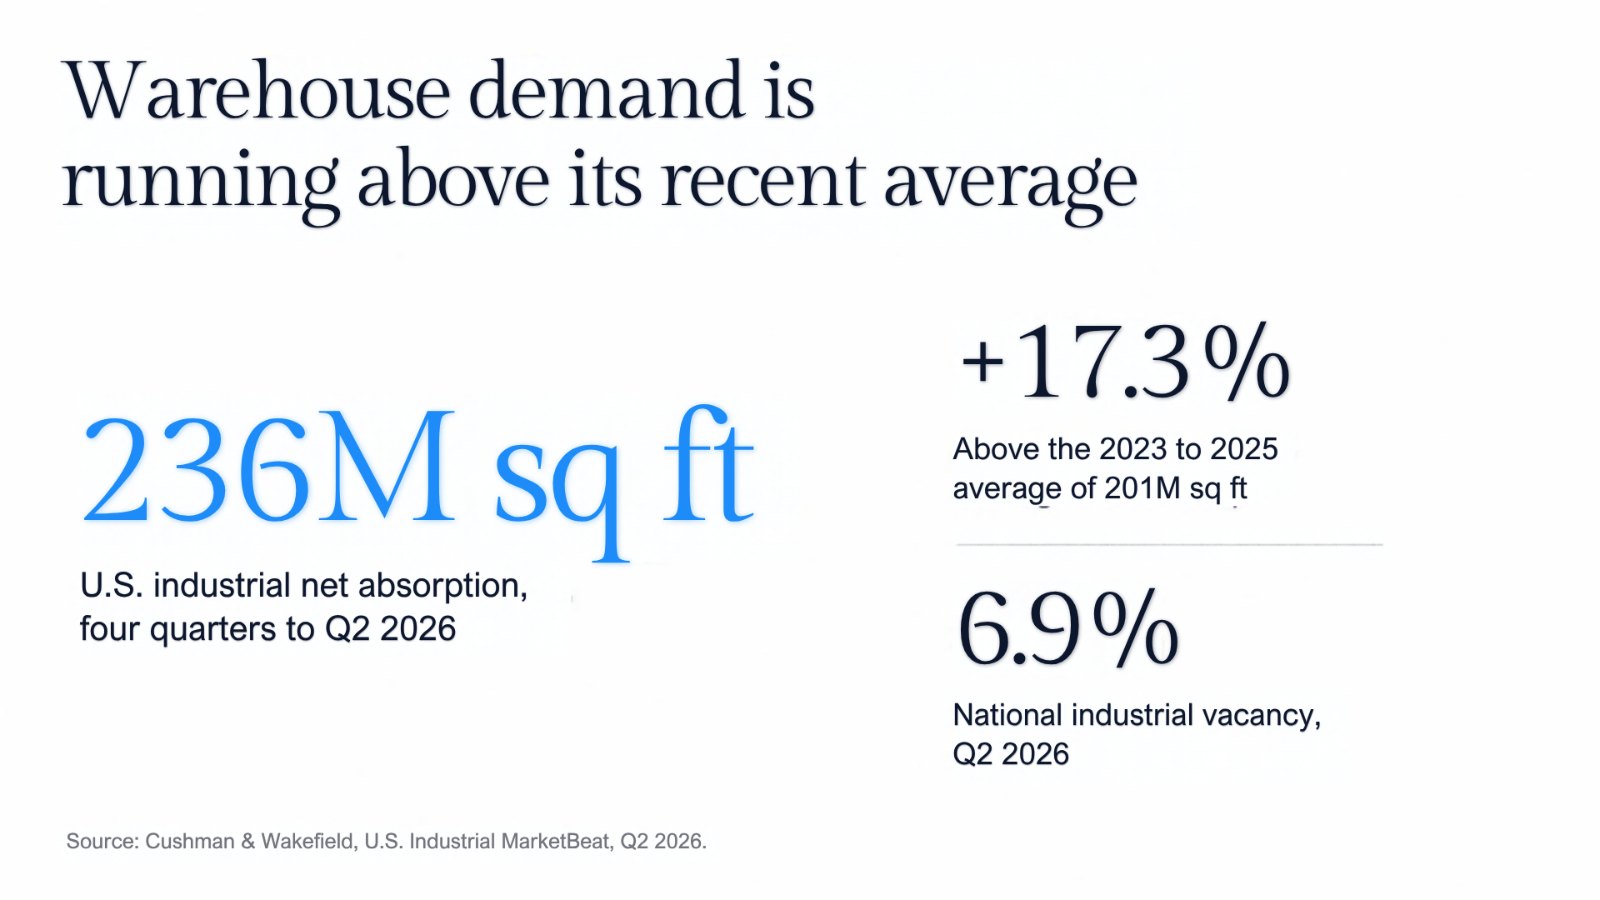
The leasing data has moved in the opposite direction to that reading. Cushman & Wakefield reported second-quarter net absorption of 62.1 million square feet and a four-quarter total of 236 million square feet, 17.3% above the 2023 to 2025 average of 201 million. National vacancy fell to 6.9%. CBRE’s measure of absorption reached 85.1 million square feet in the second quarter, the first quarter since mid-2022 in which demand exceeded new completions.
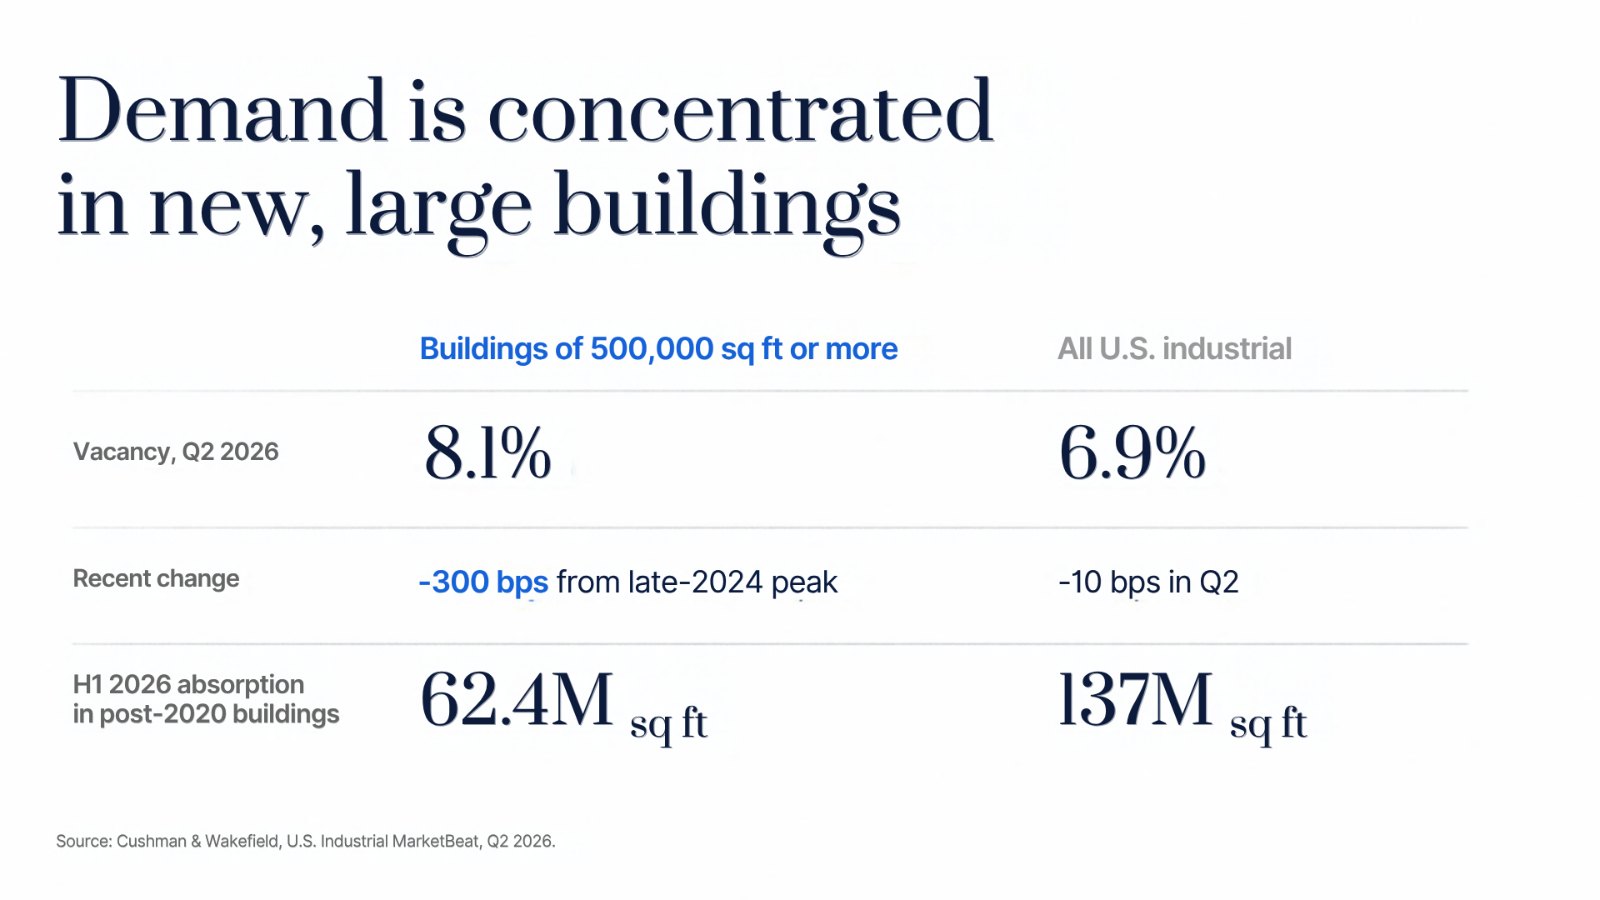
The demand is concentrated in newer, larger buildings. Warehouses built since 2020 absorbed 137 million square feet in the first half of 2026, and facilities of 500,000 square feet or more accounted for nearly half of that, according to Cushman & Wakefield. Vacancy in buildings above 500,000 square feet has fallen 300 basis points from its late-2024 peak to 8.1%.
Uncertainty has become a source of demand
The explanation is in how occupiers now run their supply chains. When the timing of imports is hard to predict, companies hold more inventory and need space that can absorb surges at short notice. Cushman & Wakefield also notes that occupiers are prioritizing higher clear heights and greater power capacity for automation, which older buildings often cannot provide.
The result is demand that depends on the volatility of imports as much as their level. A year in which September’s forecast moves by nearly seven percentage points in a month is a year in which large shippers want room to hold goods for longer. That demand shows up in absorption figures even when annual import totals barely change.
“Occupiers have started to lease space for the uncertainty itself, and uncertainty in trade policy shows few signs of ending.”
The last supply wave is almost absorbed
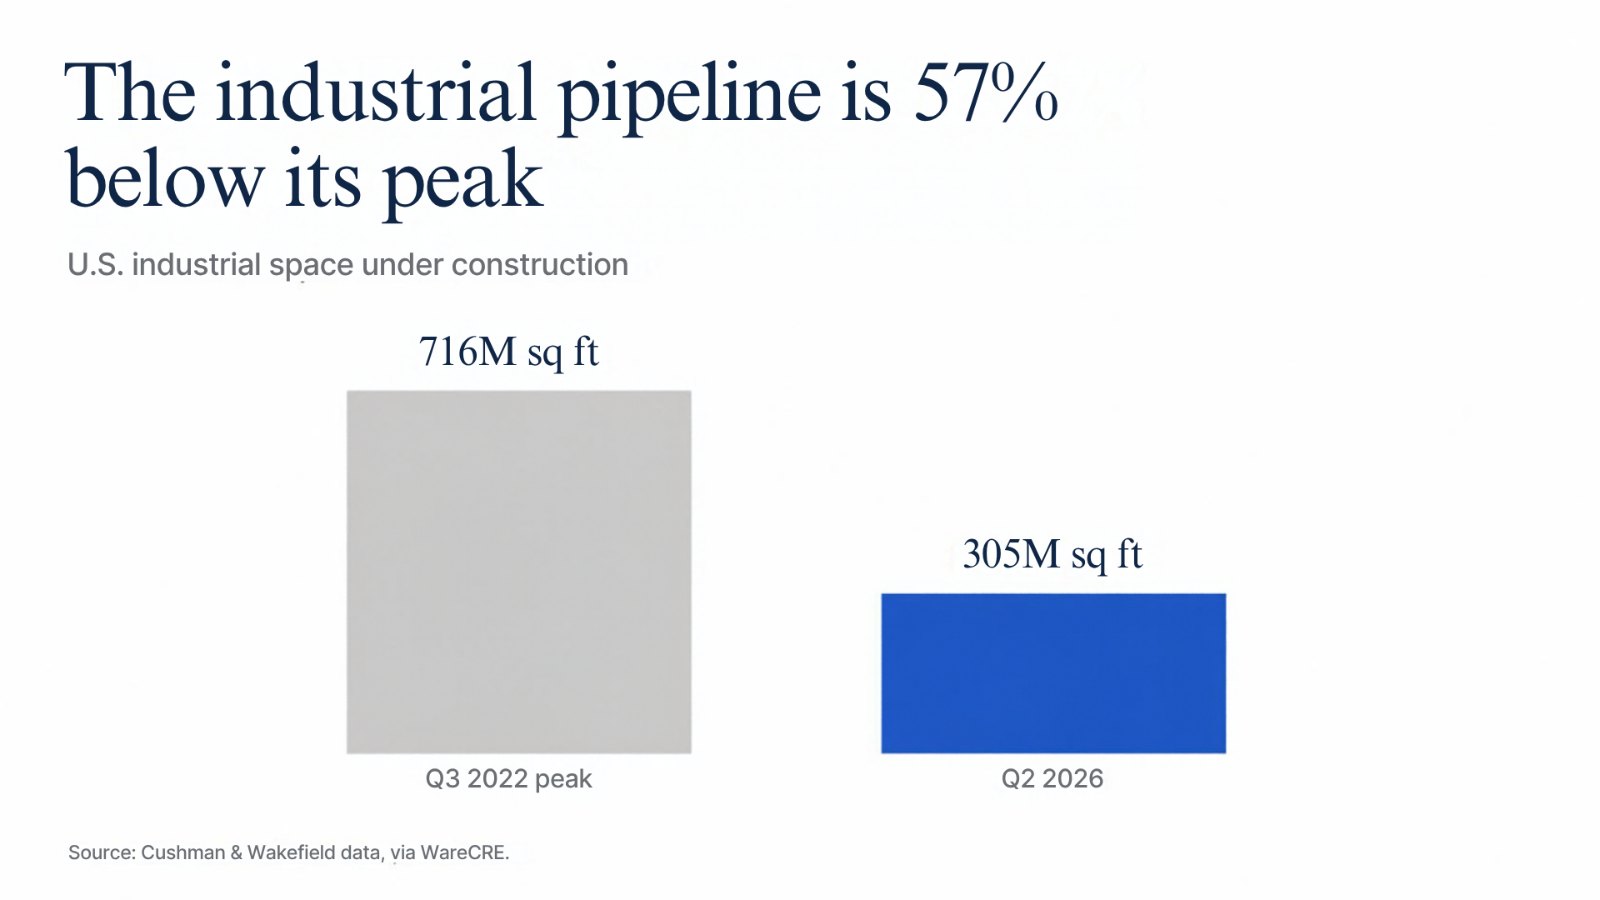
The supply side is also turning. Space under construction stood at about 305 million square feet in the second quarter, according to industry data citing Cushman & Wakefield, roughly 57% below the third-quarter 2022 peak of 716 million square feet. The record deliveries of 2022 to 2024 pushed vacancy up from its pandemic lows. With completions now running close to absorption, the national vacancy rate appears to have passed its peak.
The comparison with 2021 and 2022 is useful. That period also featured disrupted supply chains and a surge in inventory, and it produced a construction boom that took more than two years to absorb. This time, developers are building far less, and much of the demand is going to buildings that already exist.
The objection is that tariffs could still reduce demand
A fair objection is that higher tariffs eventually reduce the volume of goods, and that front-loaded imports leave warehouses full ahead of a slower 2027. Some markets are already weak. In Portland, net absorption was negative in four of the last five quarters in Cushman & Wakefield’s series, and older large-block space faces sublease competition.
We think this risk is real for older, functionally limited buildings and for markets that depended on a single import gateway. It is much smaller for modern big-box space. The absorption data shows occupiers paying for buildings that improve their operations, and that demand responds more to cost and resilience than to the annual count of containers.
Underwrite the building ahead of the national rate
In the coming year, we expect national industrial vacancy to drift lower slowly, with the decline led by large modern buildings and with older stock lagging. Rent growth will follow the same split. For investors, the practical point is to underwrite industrial assets on building quality and power capacity more than on the national vacancy rate.
September’s import surge will probably be followed by a quieter autumn, as forecasters expect. The more useful signal for industrial real estate is that occupiers have started to lease space for the uncertainty itself, and uncertainty in trade policy shows few signs of ending.
Sources: NRF and Hackett Associates, Global Port Tracker (August and September 2026); Cushman & Wakefield, U.S. Industrial MarketBeat Q2 2026; CBRE, Q2 2026 U.S. Industrial & Logistics; WareCRE; CRE Daily.